


State Senate District 35, Montana
About
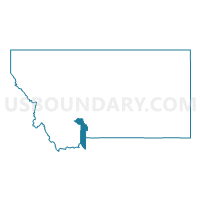
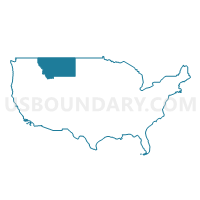
Outline

Summary
| Unique Area Identifier | 200814 |
| Name | State Senate District 35 |
| State | Montana |
| Area (square miles) | 1,593.34 |
| Land Area (square miles) | 1,566.72 |
| Water Area (square miles) | 26.62 |
| % of Land Area | 98.33 |
| % of Water Area | 1.67 |
| Latitude of the Internal Point | 45.28933990 |
| Longtitude of the Internal Point | -111.23595240 |
| Total Population | 26,667 |
| Total Housing Units | 13,674 |
| Total Households | 10,639 |
| Median Age | 37.1 |
Maps
Graphs
Select a template below for downloading or customizing gragh for State Senate District 35, Montana


Neighbors
Neighoring State Legislative District Upper Chamber (by Name) Neighboring State Legislative District Upper Chamber on the Map
- State Senate District 17, WY
- State Senate District 18, WY
- State Senate District 31, MT
- State Senate District 32, MT
- State Senate District 34, MT
- State Senate District 35, ID
- State Senate District 36, MT
- State Senate District 39, MT
Top 10 Neighboring County (by Population) Neighboring County on the Map
- Gallatin County, MT (89,513)
- Park County, WY (28,205)
- Teton County, WY (21,294)
- Park County, MT (15,636)
- Fremont County, ID (13,242)
- Jefferson County, MT (11,406)
- Madison County, MT (7,691)
- Broadwater County, MT (5,612)
Top 10 Neighboring County Subdivision (by Population) Neighboring County Subdivision on the Map
- Bozeman CCD, Gallatin County, MT (49,560)
- Belgrade CCD, Gallatin County, MT (23,200)
- Livingston CCD, Park County, MT (12,325)
- Manhattan CCD, Gallatin County, MT (4,848)
- Gallatin Gateway CCD, Gallatin County, MT (4,839)
- Whitehall CCD, Jefferson County, MT (3,530)
- Three Forks CCD, Gallatin County, MT (3,098)
- Madison Valley CCD, Madison County, MT (3,029)
- Townsend West CCD, Broadwater County, MT (2,197)
- Big Sky CCD, Gallatin County, MT (2,195)
Top 10 Neighboring Place (by Population) Neighboring Place on the Map
- Bozeman city, MT (37,280)
- Belgrade city, MT (7,389)
- Four Corners CDP, MT (3,146)
- Big Sky CDP, MT (2,308)
- Three Forks city, MT (1,869)
- Manhattan town, MT (1,520)
- West Yellowstone town, MT (1,271)
- Churchill CDP, MT (902)
- Gallatin Gateway CDP, MT (856)
- King Arthur Park CDP, MT (738)
Top 10 Neighboring Elementary School District (by Population) Neighboring Elementary School District on the Map
- Bozeman Elementary School District, MT (51,460)
- Belgrade Elementary School District, MT (19,906)
- Three Forks Elementary School District, MT (3,509)
- Manhattan Elementary School District, MT (2,703)
- Ophir Elementary School District, MT (2,153)
- Monforton Elementary School District, MT (2,039)
- Arrowhead Elementary School District, MT (1,909)
- Amsterdam Elementary School District, MT (1,808)
- Gallatin Gateway Elementary School District, MT (1,565)
- Gardiner Elementary School District, MT (1,360)
Top 10 Neighboring Secondary School District (by Population) Neighboring Secondary School District on the Map
- Bozeman High School District, MT (59,653)
- Belgrade High School District, MT (20,094)
- Park High School District, MT (12,795)
- Manhattan High School District, MT (4,564)
- Whitehall High School District, MT (3,913)
- Three Forks High School District, MT (3,480)
- Gardiner High School District, MT (1,457)
- Willow Creek High School District, MT (275)
Top 10 Neighboring Unified School District (by Population) Neighboring Unified School District on the Map
- Teton County School District 1, WY (21,294)
- Fremont County Joint School District 215, ID (12,140)
- Ennis K-12 Schools, MT (3,482)
- West Yellowstone K-12 School District, MT (1,769)
- Harrison K-12 Schools, MT (658)
- School District Not Defined, WY (288)
Top 10 Neighboring State Legislative District Lower Chamber (by Population) Neighboring State Legislative District Lower Chamber on the Map
- State House District 35, ID (43,409)
- State House District 69, MT (14,935)
- State House District 67, MT (14,927)
- State House District 70, MT (11,732)
- State House District 63, MT (10,738)
- State House District 68, MT (10,656)
- State House District 71, MT (10,573)
- State House District 61, MT (9,919)
- State House District 23, WY (9,763)
- State House District 77, MT (9,685)
Top 10 Neighboring 111th Congressional District (by Population) Neighboring 111th Congressional District on the Map
- Congressional District (at Large), MT (989,415)
- Congressional District 2, ID (725,652)
- Congressional District (at Large), WY (563,626)
Top 10 Neighboring Census Tract (by Population) Neighboring Census Tract on the Map
- Census Tract 2, Gallatin County, MT (9,162)
- Census Tract 5.03, Gallatin County, MT (8,858)
- Census Tract 1.03, Gallatin County, MT (7,355)
- Census Tract 9653, Park County, WY (7,155)
- Census Tract 5.02, Gallatin County, MT (4,908)
- Census Tract 4, Gallatin County, MT (4,848)
- Census Tract 12, Gallatin County, MT (4,839)
- Census Tract 1.01, Gallatin County, MT (4,703)
- Census Tract 9676, Teton County, WY (4,600)
- Census Tract 2, Park County, MT (4,067)
Top 10 Neighboring 5-Digit ZIP Code Tabulation Area (by Population) Neighboring 5-Digit ZIP Code Tabulation Area on the Map
- 59715, MT (31,567)
- 59718, MT (27,367)
- 59714, MT (18,182)
- 59047, MT (11,880)
- 59741, MT (4,352)
- 59752, MT (3,431)
- 59729, MT (2,141)
- 59716, MT (1,798)
- 59730, MT (1,790)
- 59758, MT (1,769)
Data
Demographic, Population, Households, and Housing Units
** Data sources from census 2010 **
Show Data on Map
Download Full List as CSV
Download Quick Sheet as CSV
| Subject | This Area | Montana | National |
|---|---|---|---|
| POPULATION | |||
| Total Population Map | 26,667 | 989,415 | 308,745,538 |
| POPULATION, HISPANIC OR LATINO ORIGIN | |||
| Not Hispanic or Latino Map | 25,881 | 960,850 | 258,267,944 |
| Hispanic or Latino Map | 786 | 28,565 | 50,477,594 |
| POPULATION, RACE | |||
| White alone Map | 25,606 | 884,961 | 223,553,265 |
| Black or African American alone Map | 62 | 4,027 | 38,929,319 |
| American Indian and Alaska Native alone Map | 203 | 62,555 | 2,932,248 |
| Asian alone Map | 148 | 6,253 | 14,674,252 |
| Native Hawaiian and Other Pacific Islander alone Map | 16 | 668 | 540,013 |
| Some Other Race alone Map | 193 | 5,975 | 19,107,368 |
| Two or More Races Map | 439 | 24,976 | 9,009,073 |
| POPULATION, SEX | |||
| Male Map | 13,722 | 496,667 | 151,781,326 |
| Female Map | 12,945 | 492,748 | 156,964,212 |
| POPULATION, AGE (18 YEARS) | |||
| 18 years and over Map | 19,926 | 765,852 | 234,564,071 |
| Under 18 years | 6,741 | 223,563 | 74,181,467 |
| POPULATION, AGE | |||
| Under 5 years | 1,978 | 62,423 | 20,201,362 |
| 5 to 9 years | 1,947 | 60,765 | 20,348,657 |
| 10 to 14 years | 1,798 | 61,124 | 20,677,194 |
| 15 to 17 years | 1,018 | 39,251 | 12,954,254 |
| 18 and 19 years | 450 | 27,473 | 9,086,089 |
| 20 years | 221 | 13,789 | 4,519,129 |
| 21 years | 231 | 13,517 | 4,354,294 |
| 22 to 24 years | 841 | 39,832 | 12,712,576 |
| 25 to 29 years | 1,898 | 64,123 | 21,101,849 |
| 30 to 34 years | 2,145 | 58,741 | 19,962,099 |
| 35 to 39 years | 1,954 | 55,575 | 20,179,642 |
| 40 to 44 years | 1,798 | 57,370 | 20,890,964 |
| 45 to 49 years | 2,070 | 71,021 | 22,708,591 |
| 50 to 54 years | 2,171 | 78,811 | 22,298,125 |
| 55 to 59 years | 1,958 | 75,915 | 19,664,805 |
| 60 and 61 years | 587 | 27,095 | 7,113,727 |
| 62 to 64 years | 852 | 35,848 | 9,704,197 |
| 65 and 66 years | 410 | 19,811 | 5,319,902 |
| 67 to 69 years | 548 | 26,745 | 7,115,361 |
| 70 to 74 years | 665 | 34,186 | 9,278,166 |
| 75 to 79 years | 475 | 25,637 | 7,317,795 |
| 80 to 84 years | 342 | 20,342 | 5,743,327 |
| 85 years and over | 310 | 20,021 | 5,493,433 |
| MEDIAN AGE BY SEX | |||
| Both sexes Map | 37.10 | 39.80 | 37.20 |
| Male Map | 37.30 | 38.80 | 35.80 |
| Female Map | 36.90 | 41.00 | 38.50 |
| HOUSEHOLDS | |||
| Total Households Map | 10,639 | 409,607 | 116,716,292 |
| HOUSEHOLDS, HOUSEHOLD TYPE | |||
| Family households: Map | 7,221 | 257,087 | 77,538,296 |
| Husband-wife family Map | 6,142 | 201,611 | 56,510,377 |
| Other family: Map | 1,079 | 55,476 | 21,027,919 |
| Male householder, no wife present Map | 433 | 18,431 | 5,777,570 |
| Female householder, no husband present Map | 646 | 37,045 | 15,250,349 |
| Nonfamily households: Map | 3,418 | 152,520 | 39,177,996 |
| Householder living alone Map | 2,526 | 121,775 | 31,204,909 |
| Householder not living alone Map | 892 | 30,745 | 7,973,087 |
| HOUSEHOLDS, HISPANIC OR LATINO ORIGIN OF HOUSEHOLDER | |||
| Not Hispanic or Latino householder: Map | 10,419 | 401,678 | 103,254,926 |
| Hispanic or Latino householder: Map | 220 | 7,929 | 13,461,366 |
| HOUSEHOLDS, RACE OF HOUSEHOLDER | |||
| Householder who is White alone | 10,323 | 379,280 | 89,754,352 |
| Householder who is Black or African American alone | 20 | 1,245 | 14,129,983 |
| Householder who is American Indian and Alaska Native alone | 70 | 18,263 | 939,707 |
| Householder who is Asian alone | 38 | 1,909 | 4,632,164 |
| Householder who is Native Hawaiian and Other Pacific Islander alone | 7 | 231 | 143,932 |
| Householder who is Some Other Race alone | 56 | 1,889 | 4,916,427 |
| Householder who is Two or More Races | 125 | 6,790 | 2,199,727 |
| HOUSEHOLDS, HOUSEHOLD TYPE BY HOUSEHOLD SIZE | |||
| Family households: Map | 7,221 | 257,087 | 77,538,296 |
| 2-person household Map | 3,462 | 129,321 | 31,882,616 |
| 3-person household Map | 1,442 | 52,940 | 17,765,829 |
| 4-person household Map | 1,349 | 43,033 | 15,214,075 |
| 5-person household Map | 640 | 20,021 | 7,411,997 |
| 6-person household Map | 225 | 7,461 | 3,026,278 |
| 7-or-more-person household Map | 103 | 4,311 | 2,237,501 |
| Nonfamily households: Map | 3,418 | 152,520 | 39,177,996 |
| 1-person household Map | 2,526 | 121,775 | 31,204,909 |
| 2-person household Map | 729 | 24,654 | 6,360,012 |
| 3-person household Map | 112 | 4,106 | 992,156 |
| 4-person household Map | 41 | 1,374 | 411,171 |
| 5-person household Map | 7 | 445 | 126,634 |
| 6-person household Map | 2 | 102 | 48,421 |
| 7-or-more-person household Map | 1 | 64 | 34,693 |
| HOUSING UNITS | |||
| Total Housing Units Map | 13,674 | 482,825 | 131,704,730 |
| HOUSING UNITS, OCCUPANCY STATUS | |||
| Occupied Map | 10,639 | 409,607 | 116,716,292 |
| Vacant Map | 3,035 | 73,218 | 14,988,438 |
| HOUSING UNITS, OCCUPIED, TENURE | |||
| Owned with a mortgage or a loan Map | 5,526 | 171,236 | 52,979,430 |
| Owned free and clear Map | 2,270 | 107,182 | 23,006,644 |
| Renter occupied Map | 2,843 | 131,189 | 40,730,218 |
| HOUSING UNITS, VACANT, VACANCY STATUS | |||
| For rent Map | 430 | 10,082 | 4,137,567 |
| Rented, not occupied Map | 20 | 773 | 206,825 |
| For sale only Map | 262 | 5,964 | 1,896,796 |
| Sold, not occupied Map | 31 | 1,353 | 421,032 |
| For seasonal, recreational, or occasional use Map | 2,000 | 38,510 | 4,649,298 |
| For migrant workers Map | 19 | 283 | 24,161 |
| Other vacant Map | 273 | 16,253 | 3,652,759 |
| HOUSING UNITS, OCCUPIED, AVERAGE HOUSEHOLD SIZE BY TENURE | |||
| Total: Map | 2.49 | 2.35 | 2.58 |
| Owner occupied Map | 2.57 | 2.42 | 2.65 |
| Renter occupied Map | 2.29 | 2.18 | 2.44 |
| HOUSING UNITS, OCCUPIED, TENURE BY RACE OF HOUSEHOLDER | |||
| Owner occupied: Map | 7,796 | 278,418 | 75,986,074 |
| Householder who is White alone Map | 7,628 | 263,920 | 63,446,275 |
| Householder who is Black or African American alone Map | 10 | 380 | 6,261,464 |
| Householder who is American Indian and Alaska Native alone Map | 40 | 8,800 | 509,588 |
| Householder who is Asian alone Map | 24 | 946 | 2,688,861 |
| Householder who is Native Hawaiian and Other Pacific Islander alone Map | 4 | 107 | 61,911 |
| Householder who is Some Other Race alone Map | 19 | 819 | 1,975,817 |
| Householder who is Two or More Races Map | 71 | 3,446 | 1,042,158 |
| Renter occupied: Map | 2,843 | 131,189 | 40,730,218 |
| Householder who is White alone Map | 2,695 | 115,360 | 26,308,077 |
| Householder who is Black or African American alone Map | 10 | 865 | 7,868,519 |
| Householder who is American Indian and Alaska Native alone Map | 30 | 9,463 | 430,119 |
| Householder who is Asian alone Map | 14 | 963 | 1,943,303 |
| Householder who is Native Hawaiian and Other Pacific Islander alone Map | 3 | 124 | 82,021 |
| Householder who is Some Other Race alone Map | 37 | 1,070 | 2,940,610 |
| Householder who is Two or More Races Map | 54 | 3,344 | 1,157,569 |
| HOUSING UNITS, OCCUPIED, TENURE BY HISPANIC OR LATINO ORIGIN OF HOUSEHOLDER | |||
| Owner occupied: Map | 7,796 | 278,418 | 75,986,074 |
| Not Hispanic or Latino householder Map | 7,696 | 274,612 | 69,617,625 |
| Hispanic or Latino householder Map | 100 | 3,806 | 6,368,449 |
| Renter occupied: Map | 2,843 | 131,189 | 40,730,218 |
| Not Hispanic or Latino householder Map | 2,723 | 127,066 | 33,637,301 |
| Hispanic or Latino householder Map | 120 | 4,123 | 7,092,917 |
| HOUSING UNITS, OCCUPIED, TENURE BY HOUSEHOLD SIZE | |||
| Owner occupied: Map | 7,796 | 278,418 | 75,986,074 |
| 1-person household Map | 1,490 | 66,631 | 16,453,569 |
| 2-person household Map | 3,327 | 118,084 | 27,618,605 |
| 3-person household Map | 1,140 | 38,883 | 12,517,563 |
| 4-person household Map | 1,095 | 32,324 | 10,998,793 |
| 5-person household Map | 502 | 14,473 | 5,057,765 |
| 6-person household Map | 175 | 5,172 | 1,965,796 |
| 7-or-more-person household Map | 67 | 2,851 | 1,373,983 |
| Renter occupied: Map | 2,843 | 131,189 | 40,730,218 |
| 1-person household Map | 1,036 | 55,144 | 14,751,340 |
| 2-person household Map | 864 | 35,891 | 10,624,023 |
| 3-person household Map | 414 | 18,163 | 6,240,422 |
| 4-person household Map | 295 | 12,083 | 4,626,453 |
| 5-person household Map | 145 | 5,993 | 2,480,866 |
| 6-person household Map | 52 | 2,391 | 1,108,903 |
| 7-or-more-person household Map | 37 | 1,524 | 898,211 |
Loading...